Logs Reference
Fields
flow logs
Flow Logs can be found in Logs Explorer under Logging, with the filter logName="projects/<google-cloud project name>/logs/discriminat-flow". A typical flow log looks like:
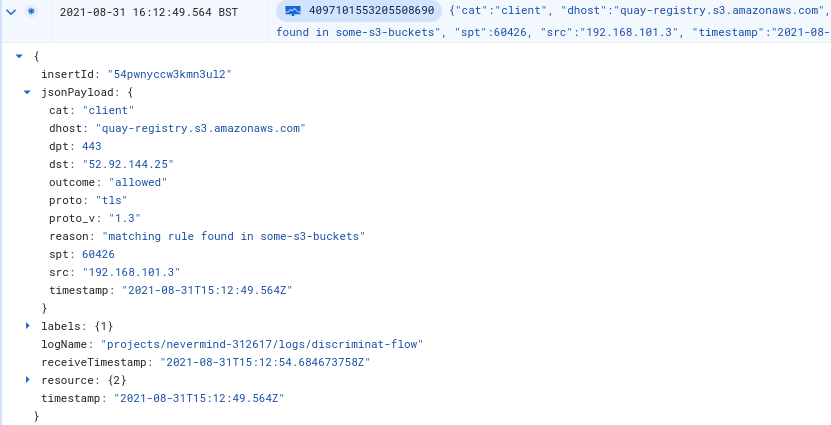
Here's a summary of the possible fields:
dhost: destination hostname/FQDN or IP Address
cat: packet origin – client or server
outcome: allowed or disallowed
src: source IP address
spt: source port
proto: tls, ssh, http or unknown protocol
proto_v: version of the identified protocol
dst: destination IP address
dpt: destination port
reason: reason for the outcome – such as in which Firewall Rule was a matching protocol rule found, cache not ready yet for a newly discovered allowlist entry, or which protocol anomaly led to the connection being disallowed
instance: the VM instance name of the DiscrimiNAT instance this log line was generated from
If X.509 CRLs are set to be allowed, or if there is some plaintext HTTP egress traffic with requisite outbound ports open, there may be HTTP flow logs with the following fields. Note that HTTP is generally not allowed unless X.509 CRLs were allowed and the requested URL was of a CRL Endpoint.
http_code, http_method, http_path, http_user_agent: these fields can be useful to understand which application the plaintext HTTP traffic is originating from
And if a Firewall Rule with a see-thru rule in it is found associated to a client application, the following fields will be also present:
see_thru_days_remaining: number of days remaining while the see-thru rule will be non-blocking, as defined in the see-thru rule itself
see_thru_gid: the Firewall Rule name where the see-thru rule was found, or %default if set via preferences
see_thru_exerted: when true, the see-thru rule had to let this connection through and there was no protocol rule that would have allowed it; when false, there was a protocol rule that would have let the connection through anyway and its presence will be identified in the reason field; or the see-thru rule has expired
Watch this 4½ minute video to understand these three fields, and their interplay with the outcome field, when viewed in the Cloud web console.
Config reference for the see-thru rules can be found here.
config logs
Config Logs can be found in Logs Explorer under Logging, with the filter logName="projects/<google-cloud project name>/logs/discriminat-config". They form an audit trail of changes made to rules and Firewall Rule associations as clients come and go.
Here's a summary of the possible fields:
cat: fqdn (addr), wildcard pattern (wildcard-addr), client, see-thru or self change category
outcome: accepted something new in the internal configuration, removed something because it had been removed from external configuration sources, or rejected something (because of reason), or warning about a syntactically correct configuration input but one which wasn't going to work as expected (because of reason)
client: IP address of an affected client (mutually exclusive with subnet)
subnet: block of IP addresses in the a.b.c.d/e notation of an affected subnet (mutually exclusive with client)
gid: the Firewall Rule name that relates to this change
addr: the FQDN, wildcard pattern or IP Address found in a Firewall Rule rule
proto: tls or ssh protocol as identified in the rule
reason: reason for usually a warning or a rejected outcome
instance: the VM instance name of the DiscrimiNAT instance this log line was generated from
If X.509 CRLs are set to be allowed there will be an additional field:
http_path: the document path over HTTP for CRL data
And if a Firewall Rule with a see-thru rule in it is found attached to a client application, there will be an additional field:
thru_date: the date until which the non-blocking see-thru mode should remain effective; past this date such a rule would lose effect
Filters
The log lines are JSON-structured so each field can be addressed specifically under the jsonPayload object. More of Logs Explorer syntax can be explored on its Logging query language page.
disallowed connections
logName="projects/<google-cloud project name>/logs/discriminat-flow"
jsonPayload.outcome="disallowed"
allowed but protocol is not TLS
logName="projects/<google-cloud project name>/logs/discriminat-flow"
jsonPayload.outcome="allowed"
-jsonPayload.proto="tls"
connections from a specific client where the destination host is not api.github.com
logName="projects/<google-cloud project name>/logs/discriminat-flow"
jsonPayload.cat="client"
jsonPayload.src="192.168.101.3"
-jsonPayload.dhost="api.github.com"
firewall rules where the see-thru mode exception has only 2 or less days left
logName="projects/<google-cloud project name>/logs/discriminat-flow"
jsonPayload.see_thru_days_remaining<=2
connections where the see-thru mode had to be used, but not for perhaps telemetry data
logName="projects/<google-cloud project name>/logs/discriminat-flow"
jsonPayload.see_thru_exerted="true"
-jsonPayload.dhost=~".*\.ubuntu\.com"
Recipes
building an allowlist from scratch (video version)
Watch this 3½ minute video to build the allowlists super quick! The two commands used in the video are also documented here, underneath the video.
Command 1:
gcloud logging read --freshness=1h --format='json(jsonPayload.dhost,jsonPayload.src,jsonPayload.see_thru_gid)' 'logName=projects/'"$GOOGLE_CLOUD_PROJECT"'/logs/discriminat-flow AND jsonPayload.dhost:* AND jsonPayload.see_thru_exerted=true AND jsonPayload.see_thru_gid="'$RULE_NAME'"' | dd of=frequency-fqdns.json
Command 2:
cat frequency-fqdns.json | jq --raw-output 'group_by(.jsonPayload.dhost) | map(.[0] + {"count": length}) | sort_by(.count) | reverse | [.[].jsonPayload.dhost] | @csv' | tr --delete '"'
building an allowlist from scratch (text version)
This method is now deprecated in favour of the Cloud Shell based method above.
Create a new Firewall Rule, with a
see-thrurule in it. See the config reference and an example here. Give it a thru date sufficient enough to capture all stages of the application's lifecycle, such as deployment, restart, the occassional uploading of reports, telemetry, monitoring, etc. Note the Firewall Rule name.Attach this Firewall Rule to the application. In GCP this would be adding the target network tags in the Firewall Rule to the network tags of the workload/VMs.
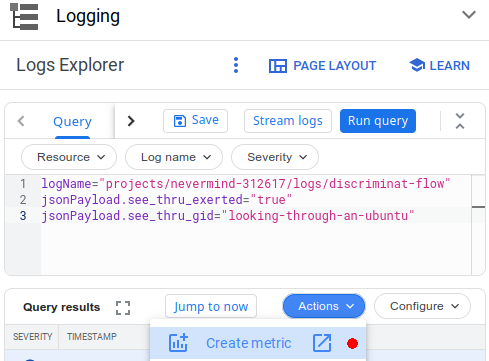
In the Logs Explorer under Logging, enter the following query and run it. Note: You'll have to replace the Firewall Rule name in this example with the one that was created above.
logName="projects/<google-cloud project name>/logs/discriminat-flow"
jsonPayload.see_thru_exerted="true"
jsonPayload.see_thru_gid="firewall-rule-replace-me-name"
Now create a metric out of this query from the Actions menu.
Add these three labels to the metric, and save it.
Name Type Field Name dhost STRING jsonPayload.dhost proto STRING jsonPayload.proto dpt STRING jsonPayload.dpt 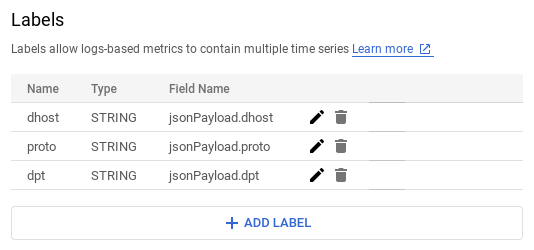
Now let the application follow its normal course of lifecycle. This could last a few hours, days or weeks depending on the application.
When you feel some useful traffic may have been logged, visit the Metrics Explorer under Monitoring, and select the metric you saved earlier. Choose an appropriate timespan, and group the results by the
dpt,protoanddhostfields.

This will produce a table of results like:
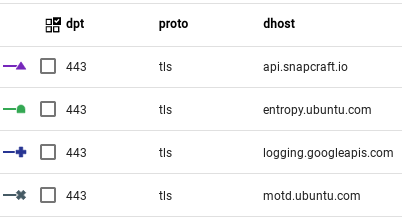
- From the information in the results table, specific allowlist protocol rules can be created. For example:
discriminat:tls:entropy.ubuntu.com,motd.ubuntu.com
and discriminat:tls:logging.googleapis.com with protocol TCP and destination port 443. Although you may want to reconsider allowing any telemetry endpoints.
For the full reference on creating these protocol rules along with an example, see the config reference.
Once these protocol rules are attached to the application, run the full application lifecycle again, and then the query at #3 to ensure that
see_thru_exerteddid not have to be used to let any disallowed traffic through. There may be the case where you choose to disallow certain destinations anyway – those are to be expected and can be selectively filtered out from view.Detach or remove the
see-thrurule from the application and give it another full lifecycle run just to ensure it works smoothly.The metric created at #3 can now be deleted.